Paper Trail
trace first instrumentation: a mental model
over the years i’ve found myself in variations of the same conversation: explaining trace-first instrumentation to a room that’s skeptical. not hostile, just unconvinced. the counterarguments are always reasonable. “logs are essential for debugging.” “we need structured logs for incident investigation.” “you can’t replace logs with traces.”
and they’re right. you can’t replace logs with traces. that’s not the argument.
the argument
the canonical framing from google SRE and cindy sridharan’s distributed systems observability: “metrics for detection, traces for location, logs for explanation.” three pillars, distinct purposes. i’m not contesting that.
what i am contesting is the implementation order.
the default approach i’ve seen at multiple organisations:
- add logging calls at key points in the codebase
- when debugging, search logs for errors
- extract correlation IDs, grep across services
- reconstruct the request path from timestamps
- later, add tracing as a separate instrumentation layer
- maintain both
the trace-first approach inverts the order:
- every unit of work is a span
- context attaches as span attributes
- the fmt layer emits logs as a byproduct
- the same
tracing::info!()call writes to spans and stdout
same three pillars. different order of operations. different debugging experience.
some context
i picked this up from a staff engineer at a previous company. his framing stuck with me:
traces are the unit of work in a distributed system. logs and metrics are projections of that unit, not peers to it.
when you instrument trace-first, you’re declaring “this function is a unit of work.” the span carries context automatically. child spans inherit it. across service boundaries, if you propagate trace context, the request lifecycle is one queryable tree.
it reframed how i think about instrumentation. i don’t start with “what should i log?” anymore. i start with “what’s the unit of work?”
when you instrument logs-first, each log line is independent. correlating them requires discipline, convention, and consistent implementation across teams. miss one correlation ID? the chain breaks. (to be fair, miss one trace context propagation and you get orphan spans. the failure mode exists in both worlds, but traces make the gap visible in the UI rather than silently missing.)
i’ve worked at a few places where suggesting this pattern was met with surprise. not resistance - more like “that’s not how we’ve done it.” which is fair. logs are familiar. the tooling ecosystem grew up around logs.
but after using trace-first in production, i stopped reconstructing request paths from timestamps. that alone was worth the switch.
a working example
i put together a minimal demo to make this concrete: github.com/1x-eng/paper-trail
two rust services. gateway receives http requests, forwards to worker. worker processes, fails ~10% of the time, hits a slow path ~5% of the time. both export traces to jaeger (or any OTEL-compliant backend) via opentelemetry.
| |
open http://localhost:16686.
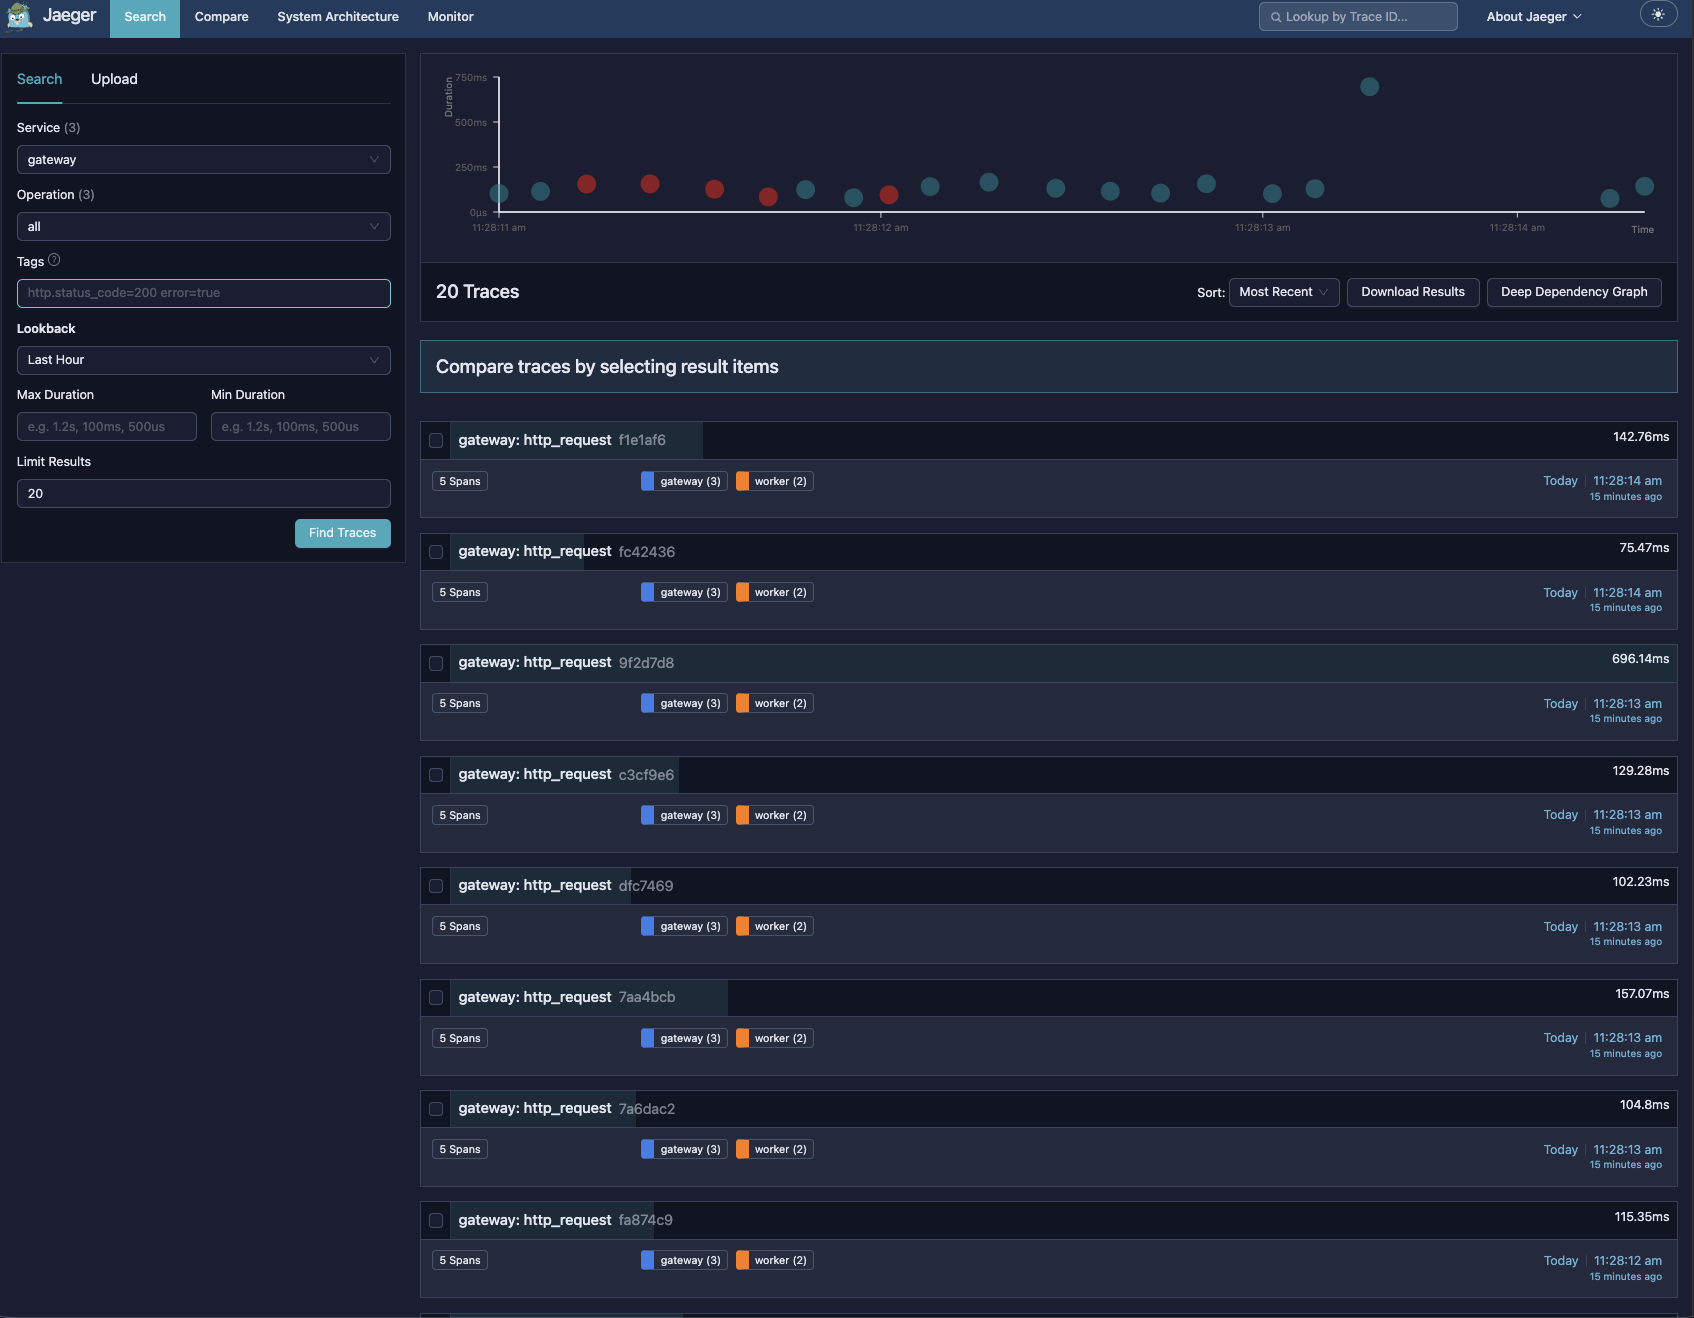 20 traces. red dots are errors. the tall green dot is a slow request (~696ms vs ~100ms normal). the symptoms are visible before clicking anything.
click a failed trace. expand it.
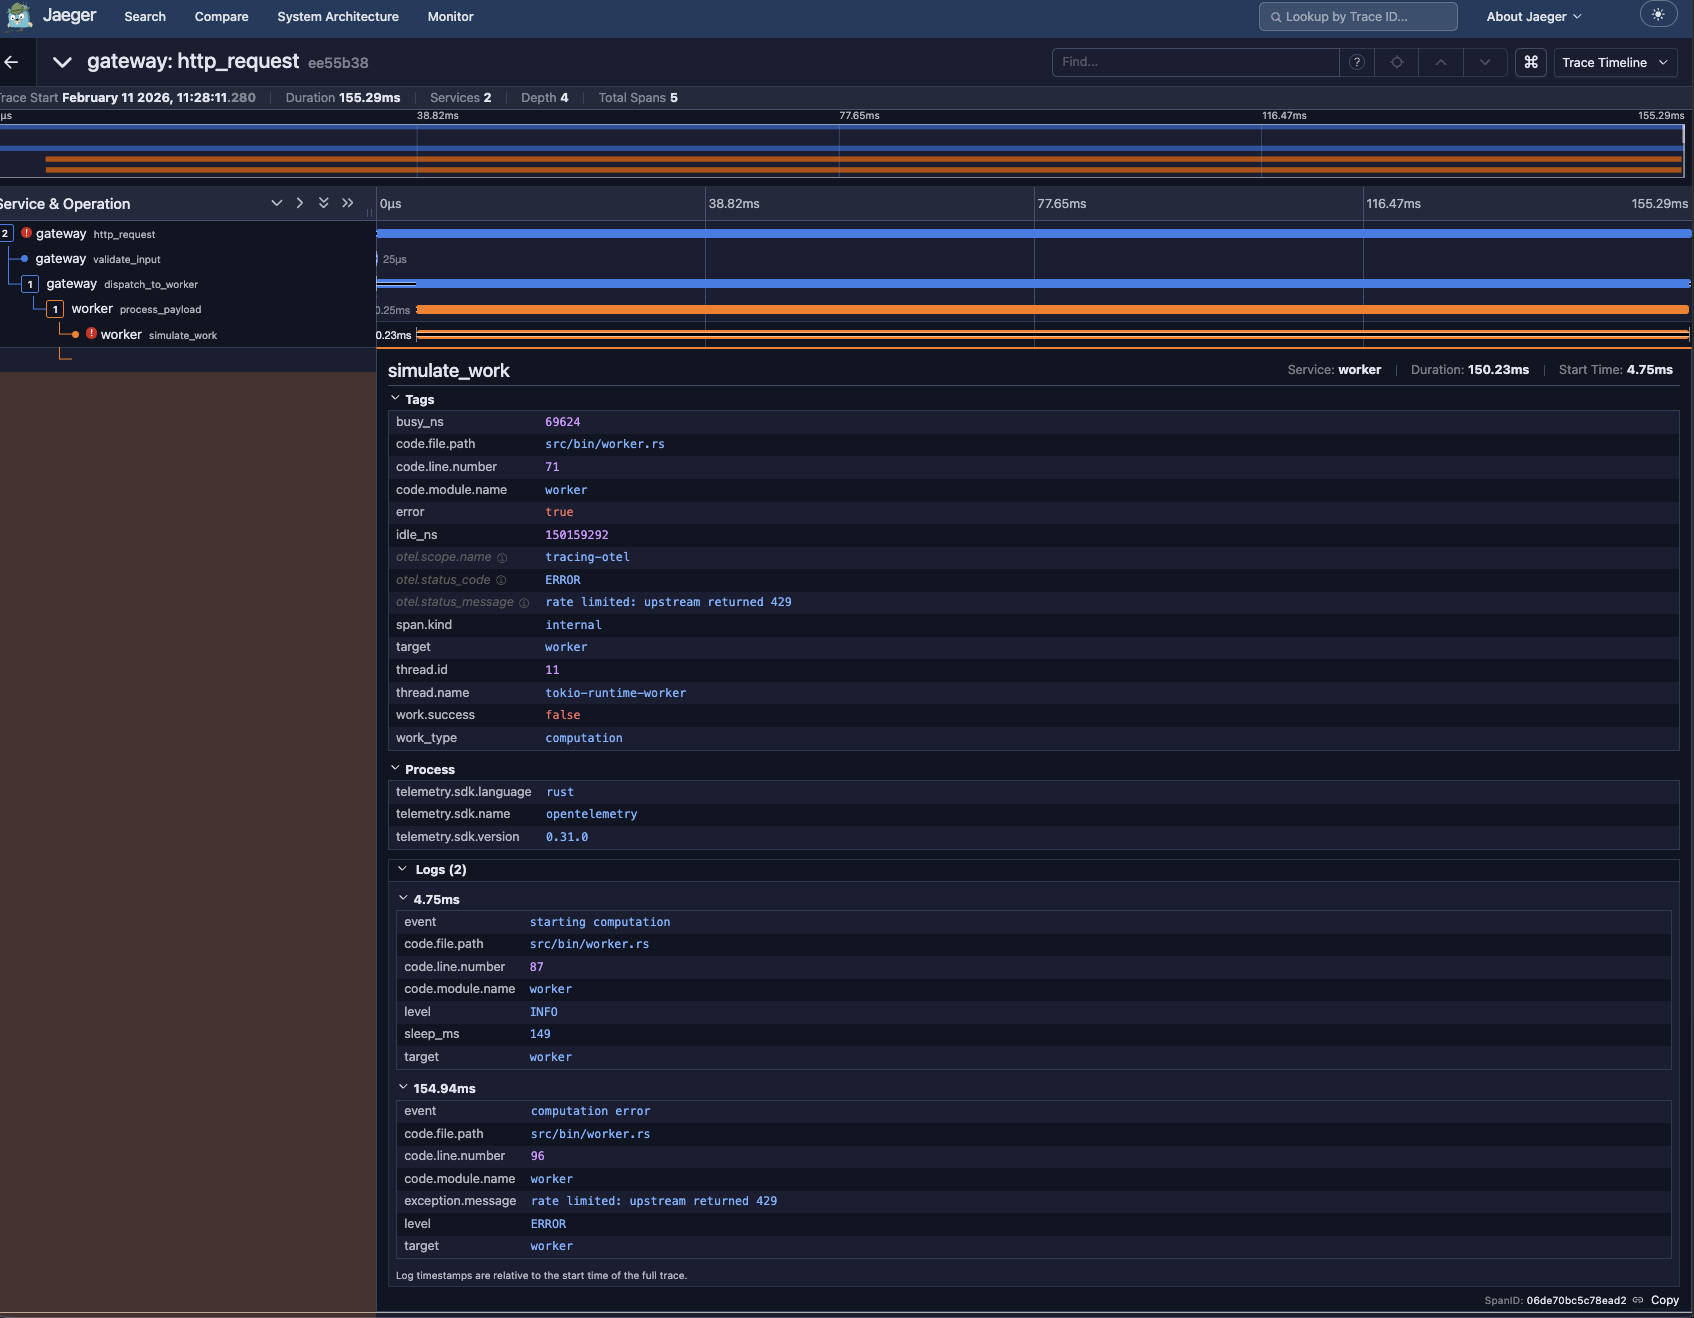 span tree across both services: gateway http_request → validate_input → dispatch_to_worker → worker process_payload → simulate_work. the error is on simulate_work.
the span detail panel shows:
otel.status_code = ERRORotel.status_message = rate limited: upstream returned 429work.success = false
below that, the Logs section contains the span events. the tracing::info!() and tracing::error!() calls, attached to this span, with context. exception.message, sleep_ms, all queryable.
for latency, the flamegraph view:
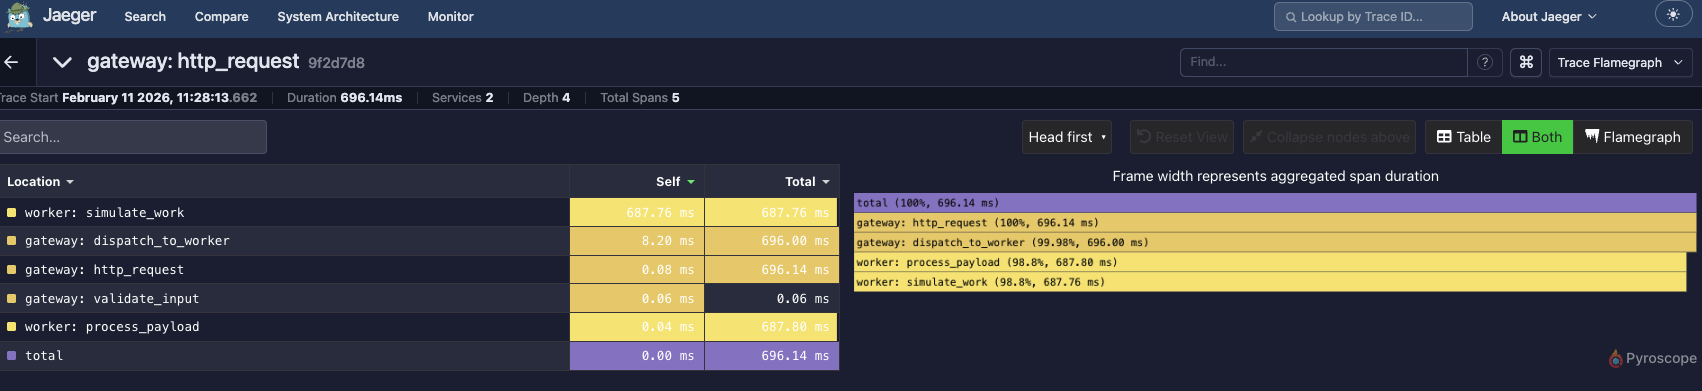 the slow path is visible without digging.
but you still need logs
yes. and they’re there.
every tracing::info!() goes to two places:
- the otel layer → span events in traces
- the fmt layer → stdout
run docker logs worker:
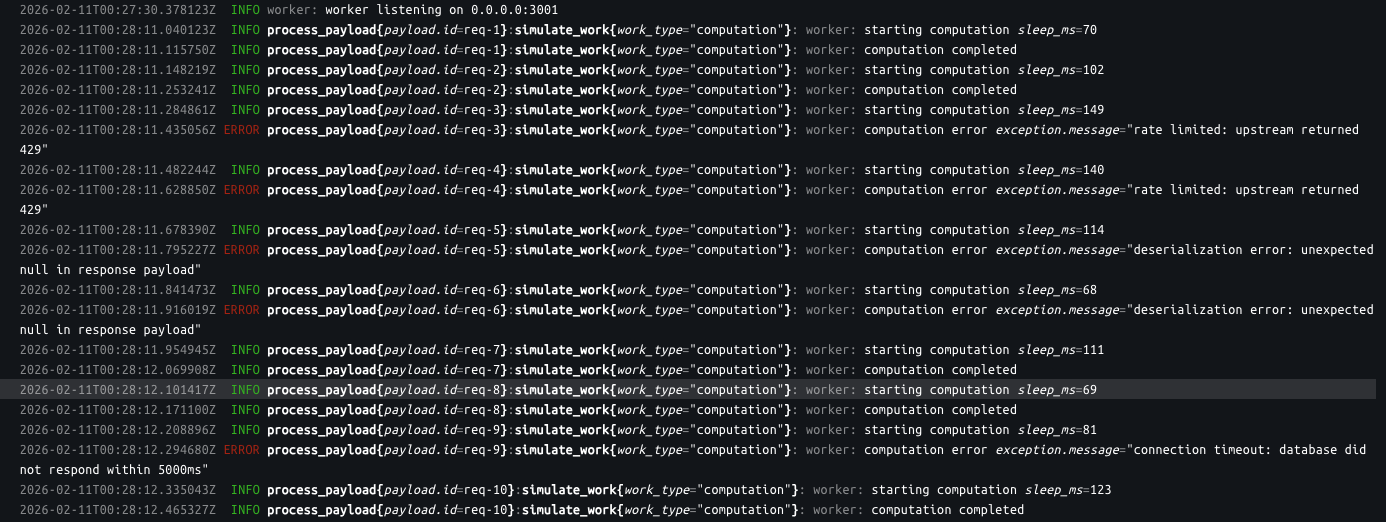 stdout logs with structured context. payload.id, work_type, exception.message. the same
 tracing::error!() call produced both the span event and this line.
the argument isn’t “don’t have logs.” it’s “don’t build a separate logging strategy.” the fmt layer gives you stdout from the same instrumentation.
the debugging workflow
logs-first
- error reported
- search logs for the error message
- find it in service B
- extract the request id
- search service A logs for that id
- check timestamps to reconstruct order
- repeat for each service in the path
trace-first
- error reported
- open tracing ui, filter by error
- click the trace
- see the span tree
- click the red span
- read the attributes
the difference in time-to-root-cause depends on system complexity. for a two-service demo, it’s marginal. for ten services with async communication, it’s significant.
runtime errors, panics, OOM
if the process dies mid-trace, the otel batch exporter might not flush.
true. but a log::info!() with buffered output has the same problem. the difference is traces add one more buffering layer (the batch exporter), so the window of data loss is wider. that said, this is an infrastructure concern. health checks, restart counts, container events. not an application instrumentation decision.
for crashes:
- the fmt layer already wrote to stdout before the crash
- docker/k8s captures stdout
- infrastructure monitoring tells you about restarts regardless of application instrumentation
application observability and infrastructure observability are different layers.
economics
trace-first instrumentation supports tail sampling. emit from the application, make sampling decisions at the collector based on outcome. error? keep. slow? keep. normal success? sample down.
log-first instrumentation typically uses head sampling or no sampling. the decision happens at emit time, before you know the outcome.
the arithmetic:
- head sampling at 5%, error rate 0.1% → 0.005% probability of capturing a failing request
- tail sampling at 100%, keep all errors, sample successes to 10% → 100% error capture, ~10% storage
tail sampling requires trace-first instrumentation. head sampling is what you’re left with when logs are independent.
caveats
this is not universal advice.
- if you have years of investment in structured logging pipelines, ripping that out is expensive and risky
- if your team hasn’t used jaeger/dd/tempo/honeycomb, there’s a learning curve
- some orgs can’t justify the collector infrastructure cost
what i am saying: if you’re starting fresh, or reconsidering your approach, trace-first is worth evaluating. the debugging workflow is different.
skeptical? run paper-trail, break it, see what the experience looks like.
if you run it and find something off, open an issue.